The old Universal Analytics has been sunset, GA4 has replaced it, and everything is good right?… But what if you don’t yet have a full year of data in GA4? What if you want to run year on year comparisons going back before your GA4 property was tracking?
Now at the moment that’s as simple as logging in to your Universal Analytics (UA) property, loading up those old faithful reports, and pulling the historic data you need. At the time of writing, you can even still import your Universal Analytics data into Looker Studio. However, Google have now confirmed that as of the 1st July 2024 your Universal Analytics data will become completely inaccessible, the API will be shut down, and your historic data will be deleted.
This means if you don’t have a backup of your key historic data in place before July 2024, it will be permanently lost. That’s where this guide comes in!
Now I’ve seen numerous solutions for this proposed online. Many reference using the built in Export to Sheets / CSV button within Google Analytics itself, but if you’ve ever tried that feature you’ll know it’s useless for acquiring a full backup.

I’ve also seen guides on importing your UA data into BigQuery (a good solution, but comes with a cost which can be difficult to calculate), or various integrations which rely on third party tools which again often come with a cost.
In this guide, I’ll go through a method that’s 100% free, will be able to support all but the most highly trafficked SME websites (including eCommerce), and will allow you to save your data for years to come.
Alternatively, if this all sounds like too much work, we can carry this out for you through our eComNow portal. With several tiers available depending on the size of your site, browse our Universal Analytics backup services here.
Step 1: The Setup
This method backs up your UA data using the official Google Analytics spreadsheet add-on to pull your data into Google Sheets, where it’ll be safely stored after UA is fully shut down.
So first, we need to install the add-on. To do this, go to Google Sheets, and create a blank Sheet – make sure the Google Sheet has been created on the same Google account you use to access your Universal Analytics property.
Then in the top menu, choose Extensions -> Add-ons -> Get add-ons. You can then search for Google Analytics, and the official add-on highlighted below should be the first result that appears:
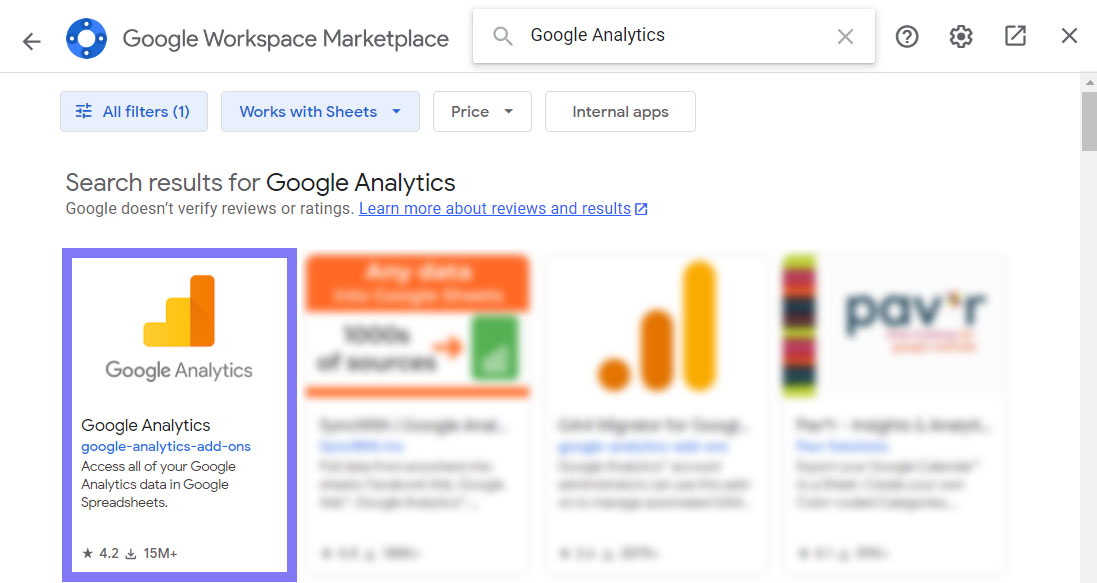
To verify that you’re installing the correct add-on, it should match the one at this link. You can now click on it, click the blue Install button, and accept / allow the permissions requests it prompts you for (you may also have to sign in to your Google account).
Once the add-on is installed, click Extensions, and you should now see a new option called Google Analytics in the menu. This means the add–on is installed, and we can begin building our backups!
Step 2: Backing Up the Key Reports
The next step is to start creating our backups! Now an area that was both a feature and an issue with UA was the sheer number of reports it came with out of the box (some of which were still in Beta at the time it was shut down!). As a result, it’s unlikely that you regularly used all of these reports for historic data analysis.
That’s why I’m going to focus on backing up the four UA reports that I find the most useful for historical comparison. However, the beauty of this method is that the process is effectively the same no matter what data you want to backup. In short, if there’s a specific report you used to regularly look at, you can just change the dimensions and metrics I’ve used in my examples below to fit your needs, or contact us for a more bespoke report.
Let’s start with one of my most commonly used UA reports, and one which is likely to be relevant to any site, whether you’re lead generation or eCommerce focused. That’s the Acquisition -> All Traffic -> Source / Medium report (basically where your traffic and conversions/revenue came from).
In your blank Sheet, go to Extensions -> Google Analytics, and choose Create New Report – a menu should appear at the right hand side of your spreadsheet. In this menu, enter Source / Medium Backup in the Name textbox.
You can now use the 3 dropdowns to select your Google Analytics Account, Property and View. Make sure you choose the same View you would go to for your Universal Analytics data – for example, if you used a view which had your internal traffic filtered out, select that one in the View dropdown.
Now we need to start adding our Metrics and Dimensions (the fields and data we’re going to pull from Google Analytics).
First, click in the Dimensions box and type Date, then select the Date field to add it. This is an important step as it’ll break your data down day by day to allow for more in-depth analysis, rather than just providing totals for the date range you’ll select.
Next we’re going to add the dimension and metrics that are used in the Universal Analytics Source / Medium report.
In the dimensions box, add Source / Medium next to date, and then in the metrics box, you need to add Users, New Users, Sessions, Bounce Rate, Pages / Session and Avg. Session Duration. The remaining metrics you add will depend on whether your site is focused on eCommerce (aiming for product purchases) or Lead Generation (aiming for goal completions).
If your site is an eCommerce store, add these metrics:
- E-Commerce Conversion Rate
- Transactions
- Revenue
If your site is goal completions focused, add these metrics:
- Goal Conversion Rate
- Goal Completions
- Goal Value (if your goals used to have different values assigned to them in UA)
Click the blue Create Report button and you should now see something that looks like the below in your Google Sheet:
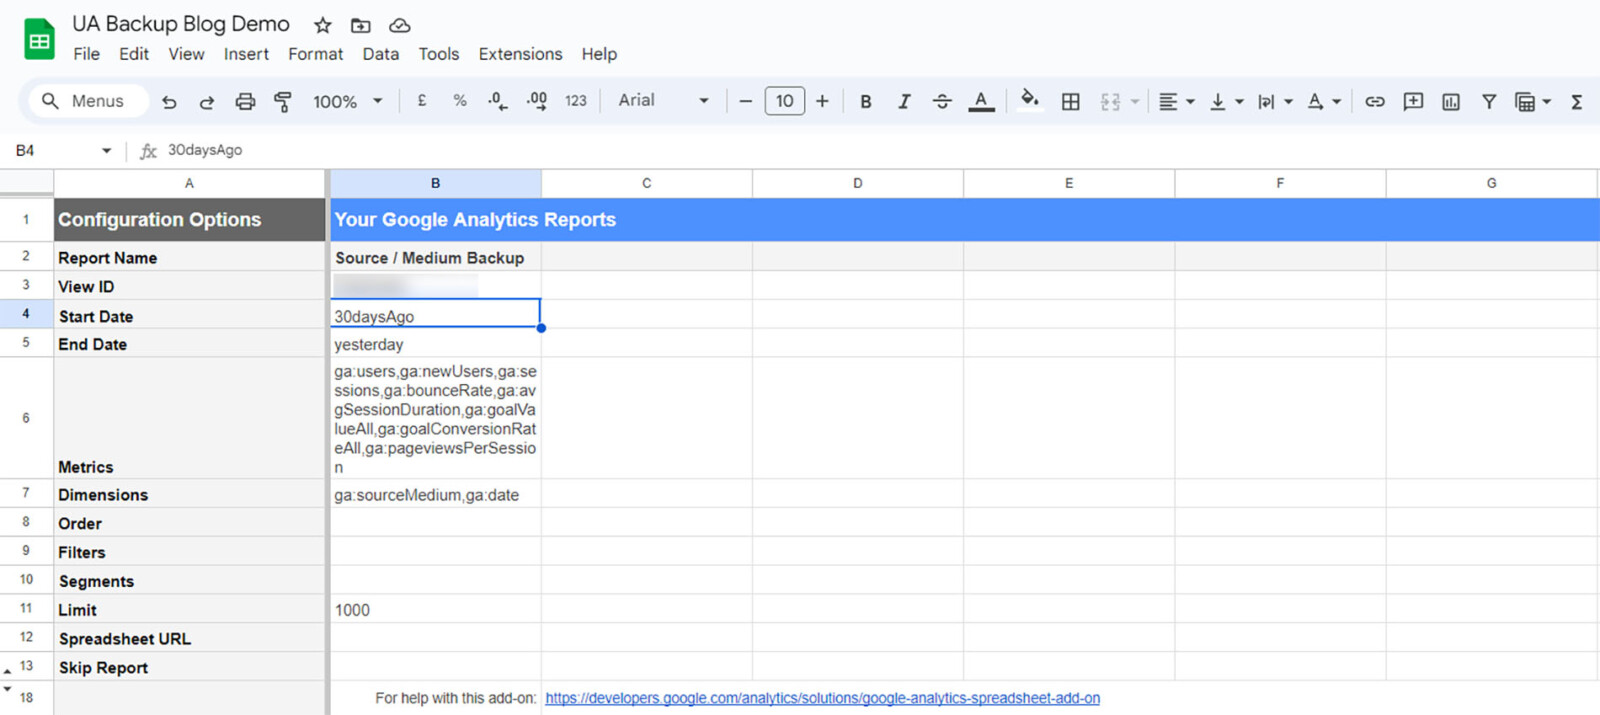
Before we run this report, there are a few final changes to make. First we want to back up our historic data so in the cell next to Start Date, we need to enter the start date and end date for the date range we’re going to use in YYYY-MM-DD format. For the purposes of this guide, I’m going to set a start date of 2022-01-01 and an end date of 2023-06-30 to cover all of 2022, and 2023 up until the end of UA processing data, but feel free to adjust this if you only need the last 6 months of 2022 for example.
You can also adjust this date range to go back even further, but be aware that trying to request too many rows may result in you hitting either the cell limit of Google Sheets, or the request limit of Google Analytics.
Optional: if you’d like your report to be sorted by date, in the cell next to Order enter the following (you will need to paste the below directly into the formula bar to make sure all the text ends up in one cell):
[{
  "fieldName": "ga:date",
  "sortOrder": "DESCENDING"
}]
The above will sort your data by date, showing the most recent data first.
Finally, we’re going to adjust the limit – this is the maximum number of rows that will be returned when you run your report. For the purposes of this guide, I’m going to set this limit to 10000, but depending on how much traffic your site receives, you can increase this number or even remove the limit entirely. Just be mindful that setting the limit too high will cause you to hit the UA request or Google Sheets limits I’ve described above.
Now we’ve set all our parameters, it’s time to pull the data from Google Analytics. To do this, in your sheet, click Extensions -> Google Analytics -> Run Reports. A Report Status popup will appear while the data is refreshed, and you should see another message indicating the report has completed successfully once it is finished (this refresh could take multiple minutes to complete for large reports).
Once the refresh is finished, you should see a new Worksheet has been created called Source / Medium Backup – if you go into it, you should now see something like the below, with your backed up UA data:
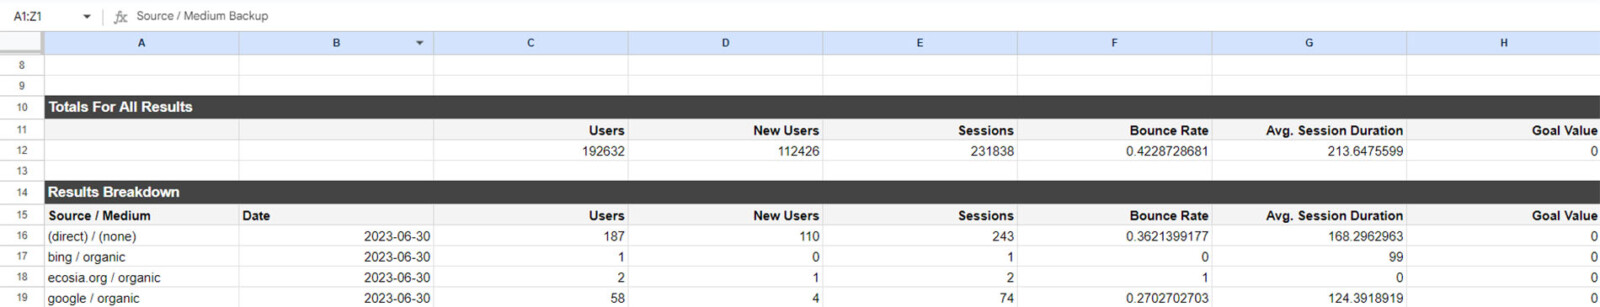
I’d now recommend checking your “Total Results Found” at the top of your report, against the “Total Results Returned” – if your total results returned is less than your total results found, just increase your Limit field we set previously to the total results found + 1, and then run the report again by clicking Extensions -> Google Analytics -> Run Reports. This way, provided you don’t hit Google Sheets or UA request limits, you’ll always return all the data in your date range.
If you find yourself being unable to run the report because you’re hitting these limits, try recreating the report with either Week of the Year, or even Month of the Year instead of the Date field in the dimensions textbox, and re-running the report. This will result in less data being fetched, at the cost of less granularity in your data backup.
One final importing factor to note: if you compare your totals for all results in Sheets to Universal Analytics, you’ll see that while Sessions and New Users exactly match the UA data, your Users count in your Sheets backup will almost certainly be higher than Google Analytics. This is because while Sheets will just add up all your User counts from each day, Google Analytics can dynamically recalculate this metric based on the date range you select.
In short, if the same User was to visit your site every single day in June, our Sheets backup would count this as 30 Users (as they would be calculated as a separate user each day they visited), whereas Google Analytics would properly count this as 1 User. Unfortunately since we have no way of accessing the data Google uses to calculate this within Analytics, our User counts will always be higher using this backup method, however, our other key metrics such as Sessions, Conversions etc. will still be accurate.
One final note: the Avg. Session Duration is returned in seconds.
Now that we’ve got our Source / Medium report data backed up, we can follow the same steps listed above to create backups of the other key Universal Analytics reports, just by repeating the Report creation process and changing the Metrics and Dimensions fields to match the below:
Behaviour -> Site Content -> Landing Pages – Dimensions:
- Date
- Landing Page
Behaviour -> Site Content -> Landing Pages – Metrics:
- Sessions
- % New Sessions
- New Users
- Bounce Rate
- Pages / Session
- Avg. Session Duration
- Goal Conversion Rate or E-Commerce Conversion Rate (whichever is relevant to your site)
- Goal Completions or Transactions (whichever is relevant to your site)
- Goal Value or Revenue (whichever is relevant to your site)
You will also need to set your Limit higher than the Source / Medium report to completely backup this data. For my example, I set this to 50000. Don’t forget to change your Start and End Dates too!
Conversions -> Goals -> Overview – Dimensions:
- Date
Conversions -> Goals -> Overview – Metrics:
- Goal Completions
To enhance the quality of your data for this report backup, you can also return the number of times each of your individual UA goals was completed. To do this, in the Report Configuration sheet replace the cell next to Metrics for your Goal Completions report with the following:
ga:goal1Completions,ga:goalCompletionsAllThis will add the number of times UA’s Goal 1 was completed to your backup. You can then repeat this process for all the UA goals you were actively tracking. For example, if you used Goal 1, Goal 3 and Goal 5 to track your key conversions, you’d just need to change the cell to this:
ga:goal1Completions,ga:goal3Completions,ga:goal5Completions,ga:goalCompletionsAllBe careful not to add any Goals you’ve switched off or haven’t ever configured in UA here, as this can cause “Invalid metric” errors when you refresh your report.
Conversions -> E-Commerce -> Product Performance – Dimensions:
- Date
- Product
Conversions -> E-Commerce -> Product Performance – Metrics:
- Product Revenue
- Unique Purchases
- Quantity
- Avg. Price
- Avg. QTY
- Product Refund Amount (if you used to pass this to UA)
- Cart-to-Detail Rate
- Buy-to-Detail Rate
You will also probably need to set your Limit to be higher than the Source / Medium report, or even replace Date with Week of the Year or Month of the Year to completely backup this data. For my example, I set this to 50000. Don’t forget to change your Start and End Dates too!
Once you’ve pulled all the report backups for the date ranges you need, at this stage you can consider your data safely backed up ahead of the Universal Analytics shutdown and data deletion. You can download the data from Sheets as a CSV for manipulation in another tool, or analyse the data and make charts using Google Sheets itself.
However… If you’d like this report data presented nicely, in tables and graphs that are near 1:1 replicas of the old Universal Analytics interface, read my final step…
Step 3: Presenting and Using Your Data
Now your Universal Analytics data is safely backed up – we can bring it into another free Google tool that’ll make it much easier to manipulate and interpret. To do this, we’re going to use Looker Studio to present our Google Sheets data more neatly.
But first, we need to do a little housekeeping. In your Google Sheets, go through all of your report backups, and delete the rows up to and including Results Breakdown (for me, this was the first 14 rows). If you’d like to keep this data, you can always make a copy of the Sheet before taking this action.
Now we’re ready to dive into Looker Studio! If you’ve never used it before, here’s a step by step guide of how to create a replica of our old Google Analytics reports.
To start, go to Looker Studio and click Create on the left hand side of the page, and choose Report. The first thing you’ll see is a prompt to add data. In the search bar, type Google Sheets and click the connector shown below:
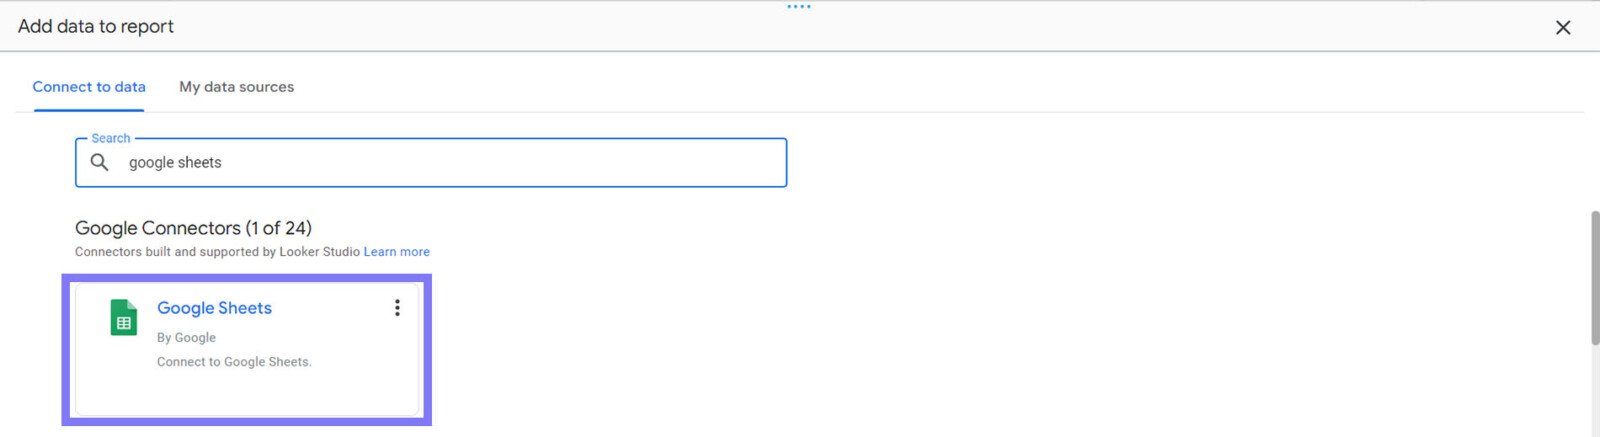
Next, you need to find the Google Sheet with your backed up data. Click URL on the left of the page, then go back to your Google Sheet with your backed up UA data, and click the Share button, then Copy Link. You can now go back to Looker Studio and paste it into the Spreadsheet URL or ID textbox.
You should see your spreadsheet is found, now we need to select the Sheet we want to use as our data source. We’ll start with replicating the UA source / medium report, so under Worksheet, choose Source / Medium Backup. Leave all the other settings the same, and click Add.
Now we’ve linked our spreadsheet up with Looker Studio, we’re going to add a date control so we can change the date range of the data as we would if we were still using Google Analytics.
To do this, in Looker Studio click Add a control -> Date Range control and then click anywhere on your blank page. You can choose a default date range that’ll be used every time the report is loaded too.
If you’d like, you can also add a title and a label for your date range control using Insert -> Text and you should end up with something like this:
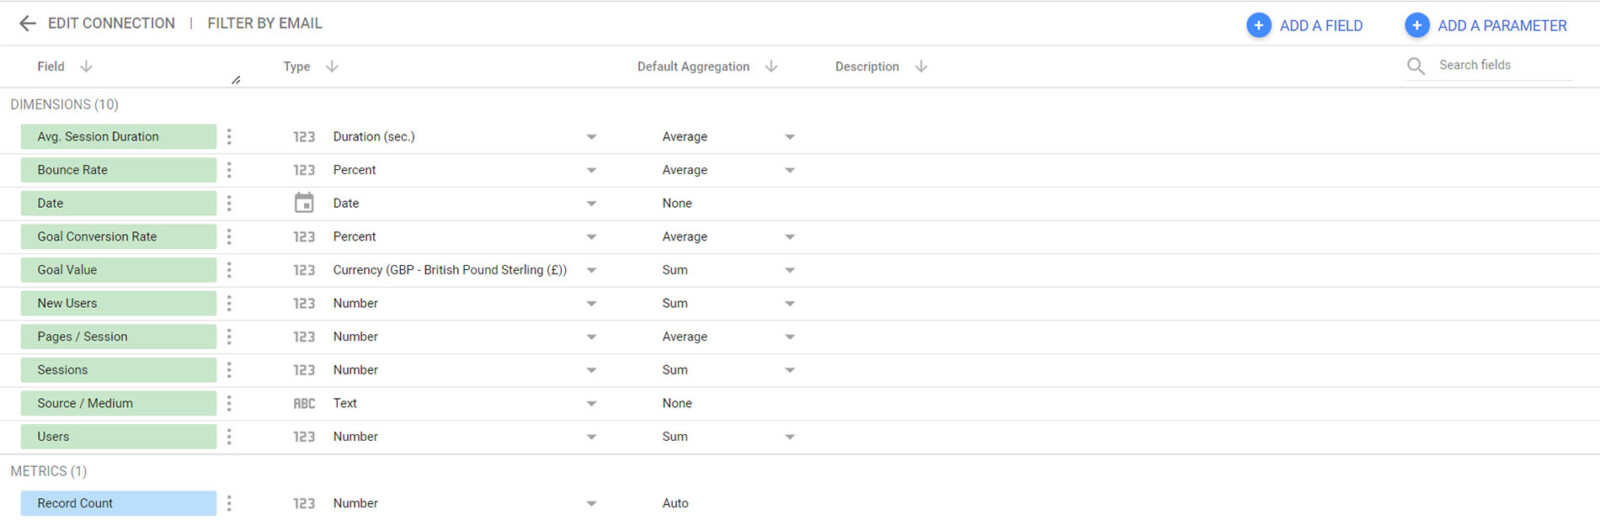
We’ve just got one more quality of life improvement to make before we start building our report. On the top menu of Looker Studio, click Resource -> Manage added data sources, then click the Edit button next to your spreadsheet.
Next to Avg. Session Duration, click in the dropdown labelled Number and choose Numeric -> Duration (sec.) then change Default aggregation from Sum to Average. This means that your Avg. Session Duration will be displayed as a time value such as 02:00 instead of just a number of seconds, like 120. Setting default aggregation to Average, also means that it’ll be averaged out in our data tables, rather than being shown as all the durations for that date range added together.
Next change Bounce Rate and Conversion Rate from Number to Numeric -> Percent and set its Default aggregation to Average, then set the Default aggregation to Average for Pages / Session. Finally, change your Goal Value (or Revenue for eCommerce) from Number to Currency -> Your local currency. You can now click Done.
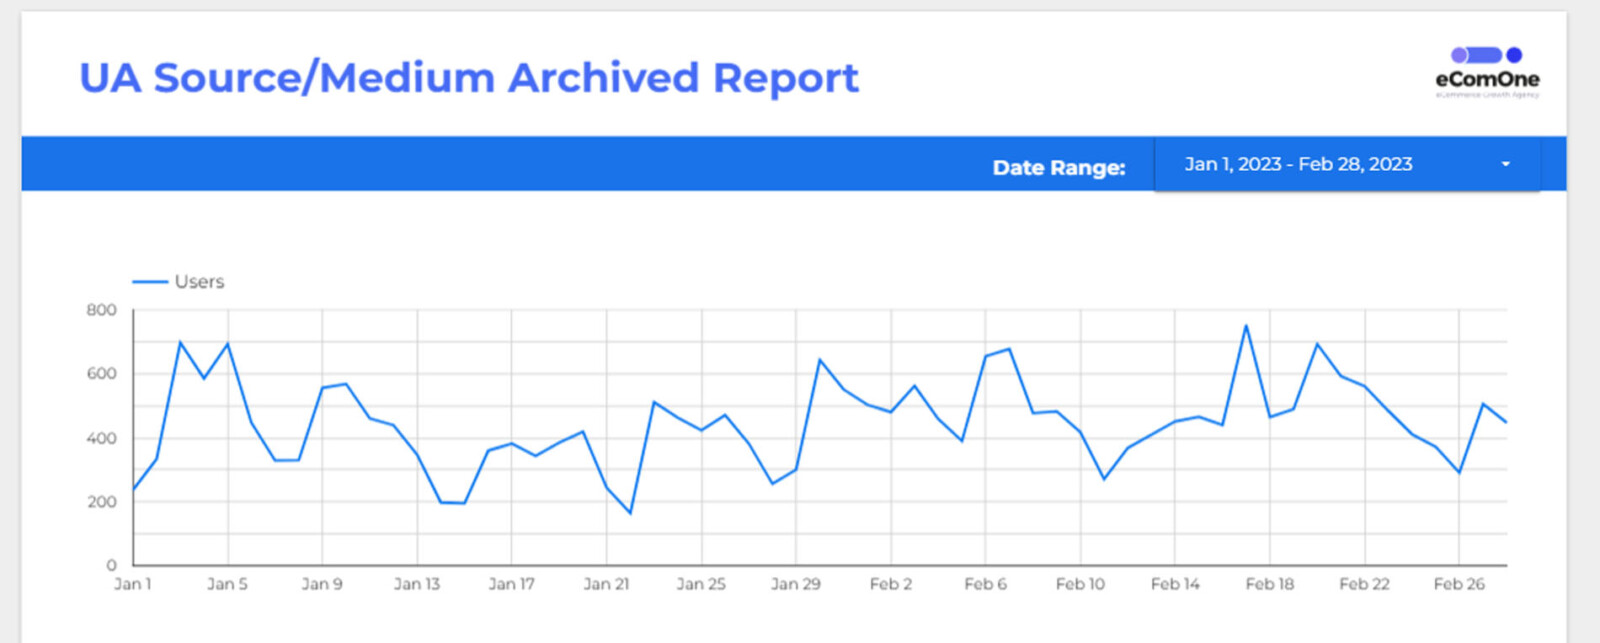
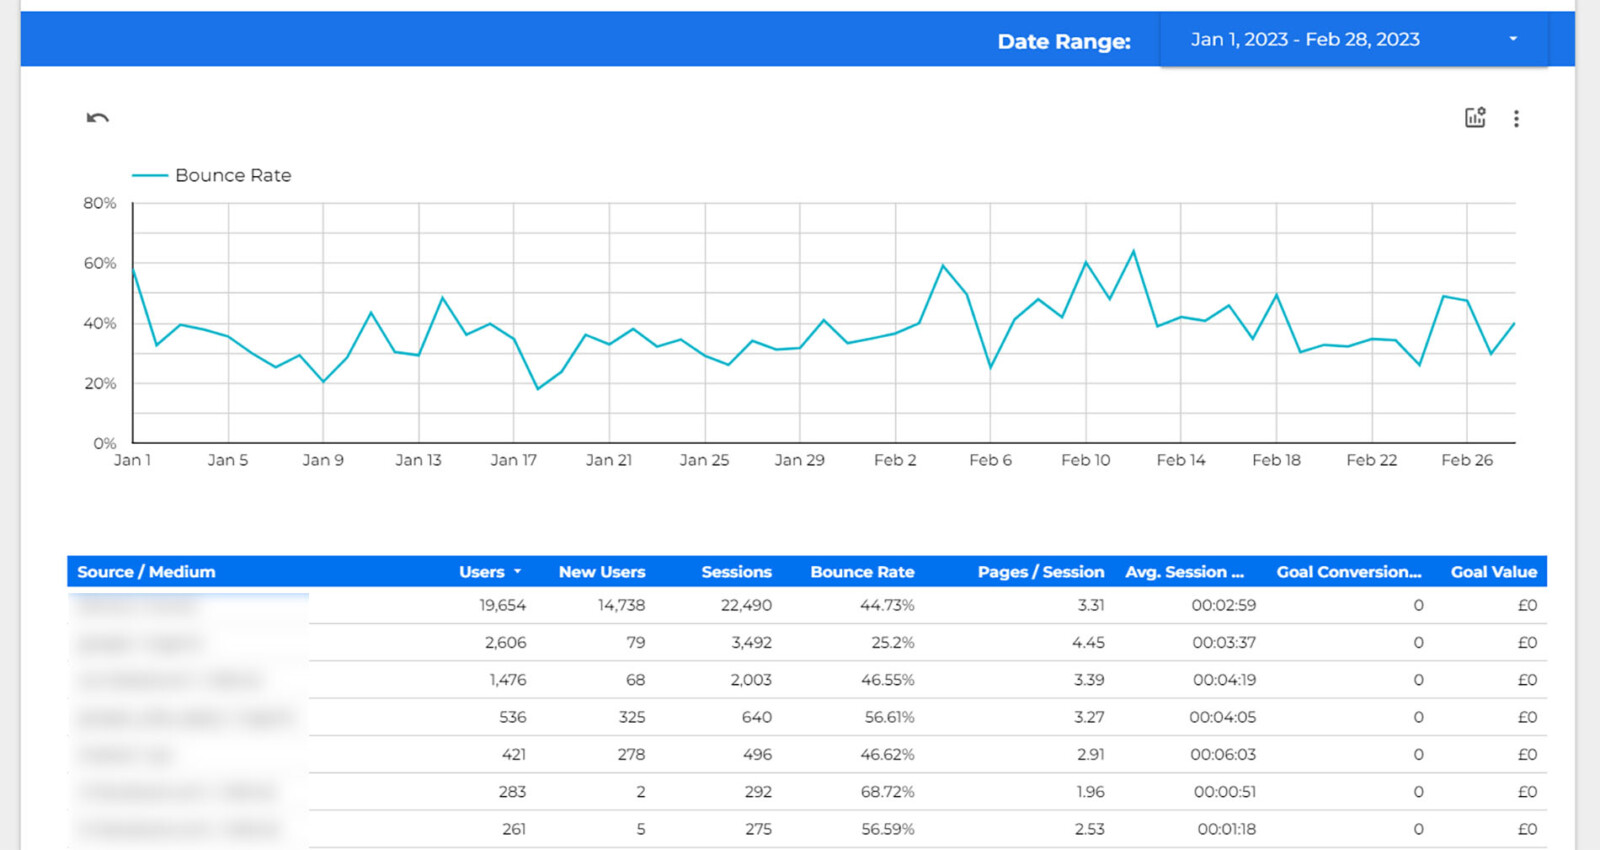
Now we can start adding our data! We’re going to aim to replicate the Universal Analytics report as closely as possible, so let’s start with the line chart that’s shown on the Source / Medium report.
Click Insert -> Time Series Chart and click anywhere in your blank page. You can also resize it to fill the entire width of your report. You can now click your line chart, and on the right hand side, we can begin configuring it.
Set the Data Source to your Spreadsheet, Set the Date Range Dimension to the Date field, make sure Dimension is also set to Date, and set Metric to Users, and make sure Default Date Range is set to Auto (this setting means it’ll automatically update the date range of the chart when you change your date range control).
You can also click the Style tab to change the look of your chart, and customise things like the line colour etc. Your chart should now look a little like this:
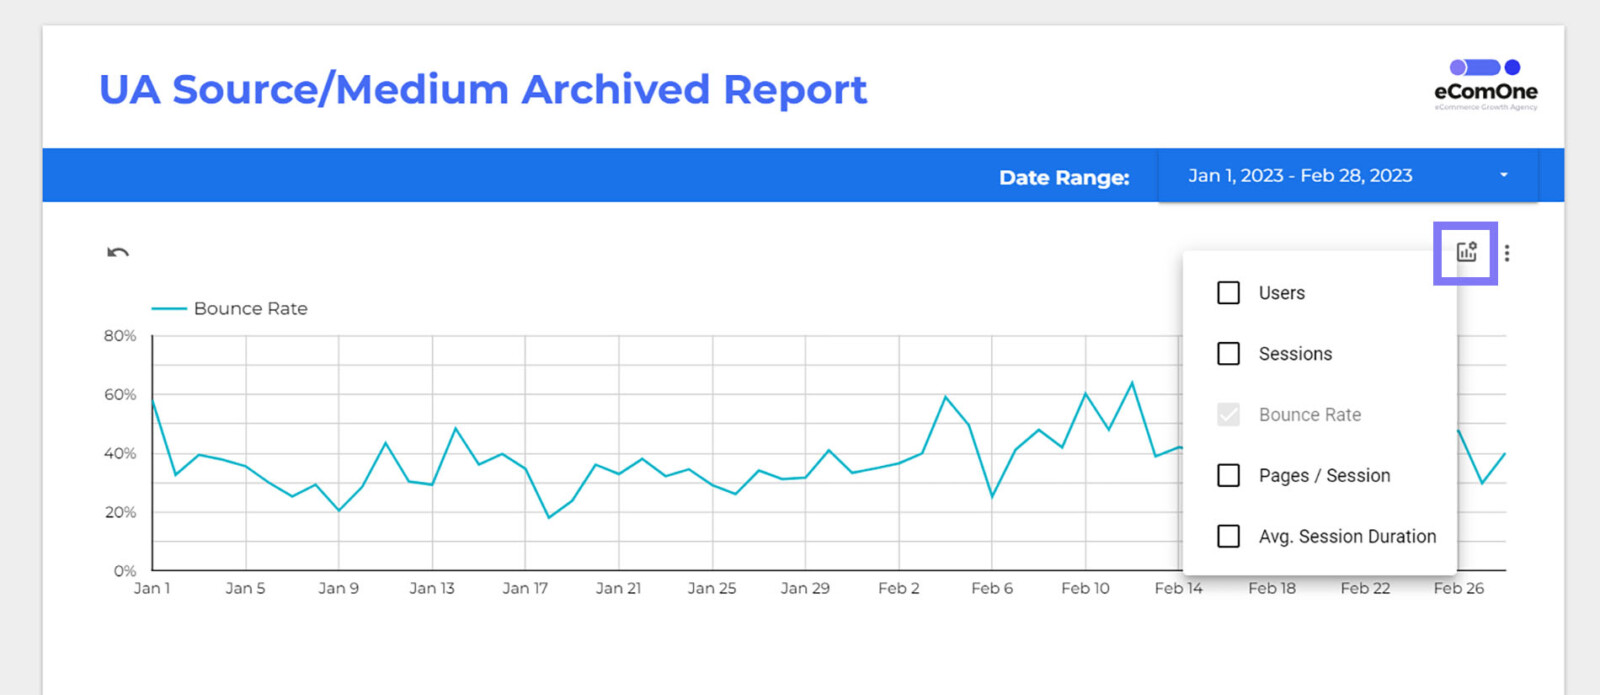
Now this is pretty close, but wouldn’t it be nice if we could easily change the metric from Users to one of our other metrics like Sessions, as we can in UA? To do this, click on your chart again, and under the Setup tab, tick Optional metrics. Now click Add metric and insert Sessions, Bounce Rate, Pages / Session and Avg. Session Duration.
To make these easy to select, we can now click on the Style tab, scroll down to the bottom of the Style settings, and change Chart Header from Show on hover, to Always show. Now if we click the View button in the top right of our report, you’ll see you can use the Optional Metrics button highlighted below to choose one of our other metrics to show on the chart.
If you clicked the View button in Looker in the previous step, click the Edit button in the top right of the screen to start editing the report again. Now we just need to insert our data table. To do this, click Insert -> Table, and once again select our Google Sheet as the Data source on the right hand side. Make sure the Date range dimension is set to Date, and only Source / Medium is added as a dimension. You can now add the following metrics to match the Universal Analytics report: Users, New Users, Sessions, Bounce Rate, Pages / Session, Avg. Session Duration, E-Commerce Conversion Rate / Goal Completion Rate, Transactions / Goal Completions and Revenue / Goal Value.
Once your metrics and dimensions are set, scroll down and tick Show summary row to show a totals row (as we see in UA). You will probably also have to drag your columns to adjust their width so that your data is a little more readable. You will also see that unlike in Sheets, your Avg. Session Duration will show as hours:minutes:seconds instead of just a seconds total.
If, like me, you also don’t find the row number column useful, you can click on the Style tab with your table selected, and untick Row numbers (as well as updating the table colours and styles if you wish).
One final note on the data: when you have a date range of longer than 1 day selected, you may notice slight differences between your Bounce Rate, Pages / Session, Avg. Session Duration and Conversion Rate metrics if you compare them to Universal Analytics. This is because we are adding all the daily averages for these metrics together, and dividing them by the number of days in the range (effectively an average of an average) rather than recalculating as Google Analytics is able to do with its additional data. Generally these differences will be relatively small unless your site experienced extreme swings in these metrics day to day, but if you’re wondering why these values aren’t a 1:1 match, that’s the answer!
You should now have something similar to the below in your Looker Studio report. Clicking on View, you can update the date range (as you would in Universal Analytics) and you’ll see your data dynamically update for easy month on month comparisons with your live GA4 data, and more.
You can also use the same principle as above to make similar reports for the other Universal Analytics backups we took in Step 2. Just add another data source to Looker with the same Spreadsheet, choose the relevant worksheet, and follow the same steps above to add the time series chart and data table.
Conclusion
Now that you’ve backed up your Google Analytics data from UA, you’ll have it safely saved and ready to easily query whenever you need to do a deep dive on the historic performance of your site, or cross check your Universal Analytics data against GA4. Even after Universal Analytics is shut down for good in 2024.
If you don’t have time to follow this guide, we can do this for you! Browse our Google Analytics backup services here or contact us for a more bespoke reporting suite.
